With our newest update, 25.0, we’ve added some new ways to view overall survey scores in the Omni Report. In addition to Weighted Score, try Net Intent and Percent Favorable. In this blog series, Score More, we’ll take time to flesh out a use case for each way to score.
A quick note: While scores may be assigned to particular items in your assessments, too, here we’re using the concept of scores based on rating scales. Rating and weighting are used for all kinds of evaluations — but you can certainly assign scores to your assessments if you need to know who passed (and who needs to review!).
What is it?
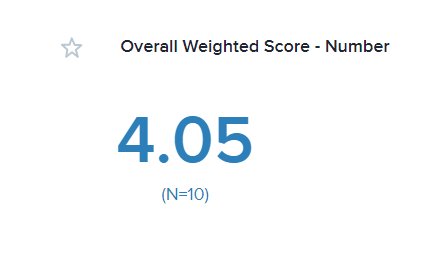
We’ll start this series with the original, the Weighted Score. Weighted Score is the average value of your selected rating questions (i.e., Rating Scale, Rating Radio Button, and Rating Drop Down). You can choose to display it simply as a number…

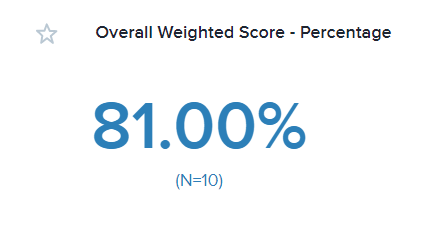
…or as a percentage. Weighted Score as Percentage is the Weighted Score divided by the highest weighted and multiplied by 100.

When to use Weighted Score
Let’s say you work for a healthcare company that administers multiple practices. After putting out a patient experience survey, you want to view your results.
You could scroll through the whole report, looking at the individual score for each question and sub-question.
Or, to get a view of the bigger picture, you could use Weighted Score. Don’t get me wrong. The Omni Report by itself is super useful and has lots of great data, but sometimes you just want a quick overview. A weighted Score is perfect for this.
How to use Weighted Score
At the top of the Omni Report, click on Score. In the pop-out, select Weighted Score, add a description, and choose where you want this to appear in your report. Next, you have the option to display the Weighted Score as either Overall Score, Question Scores, or Grouped Question Scores.
Overall Score is just what it sounds like: the average overall score of your selected rating questions. For example, if you have 20 rating questions in your survey, each rated on a scale from 1-5. Your Overall Score for Weighted Score might be a 4.05. This 4.05 is out of 5, the highest rating someone could select.
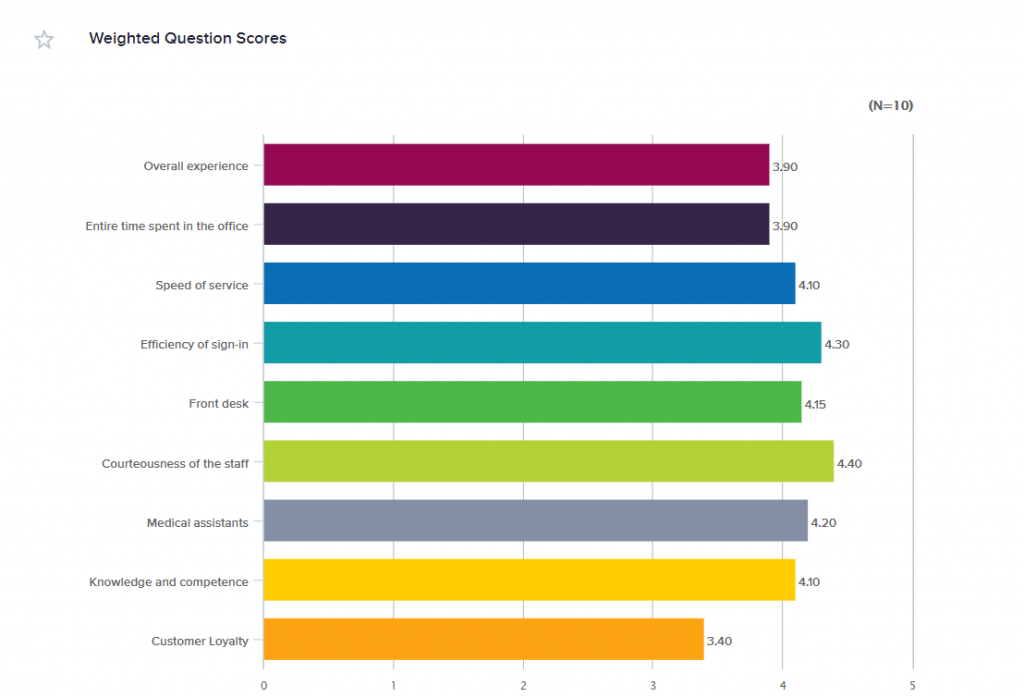
Question Scores is the average score per question. This is similar to Overall Score, but it shows the average score per question.

Grouped Questions Scores displays the average weighted scores of groups of questions that you create. For example, Group 1 could be the average of the scores of all the questions related to the check-in process. Group 2 could be the average of all the questions related to your medical assistants.

Breaking it down
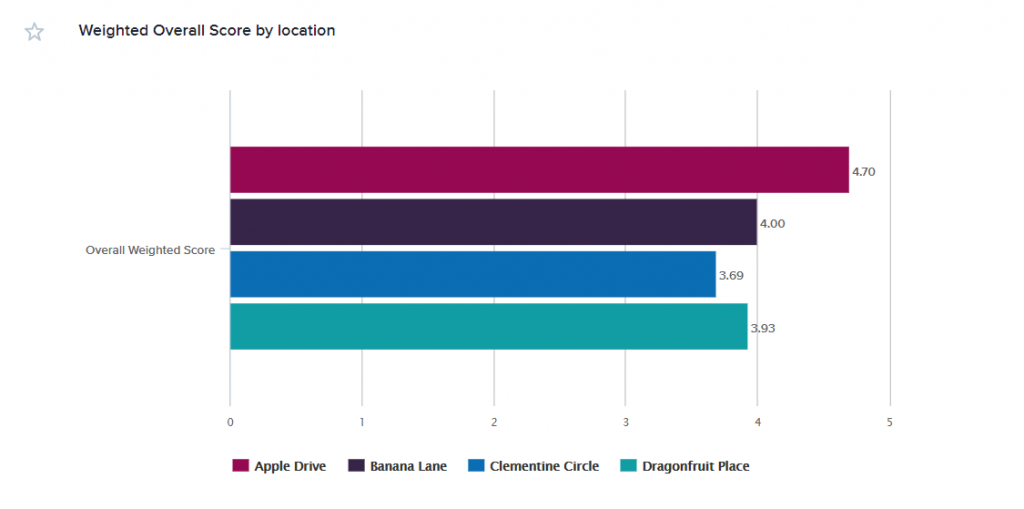
Once you choose your questions and the type of Weighted Score you want to display, you can leave it as is or break down the score with Segmentation. You can apply Segmentation based on answers, metadata, or custom data sets.
In the case of the healthcare company, you could use Segmentation to easily see how your practices stack up against each other. The graphic below shows the Overall Weighted Score of each practice, perfect for comparison at a glance.

Looking for more?
Check out our User Guide page on using Scores in your projects, and watch for the next articles in this series to learn more about Net Intent and Percent Favorable!


