You can learn a lot from the survey data you collect – that’s the point! – but too often, people look only at the overall results. The real “Aha!” moments are in the details. One easy way to do that is with data filters.
When you’re lucky (or effective) enough to collect a lot of data, it can be tempting to look at only the overall results, such as 45% of customers like the new TV ad, or 62% of travelers prefer to fly early in the morning. And that’s fine, as far as it goes – except that you likely are missing a lot of actionable insight. For instance, perhaps older customers like the TV ad, but it turns off younger viewers. Or people like to fly early in the morning if they typically travel less than two hours. Knowing that sort of detail can help you make better business decisions, such as choosing the right TV show on which to broadcast the ad.
If you know where the inflection points may be, you can cross-tabulate survey results to compare the answers to two questions: gender versus product satisfaction, for example, or buyer intention versus tool importance. But, since a pivot table shows just one item at a time, you’re apt to create one when you already suspect a relationship.
One option is to filter the report data, and to do a deep dive into the overall responses from one community segment. For instance, filter by gender, and get an idea of how women see the issue. Or view the perceptions of your Spanish-speaking community. Since you can set several filters on the data, you can get a granular view of the results, and capture the differences between, say, buyer personas.
Plus: Using filters in Sogolytics is breathlessly easy. Every report – in the Pro and Enterprise versions – has a multi-step process wherein you choose the survey, the fields to include, and the filter to apply to the data.
First thing: Create the filter! From the Report page, choose Filter Manager.
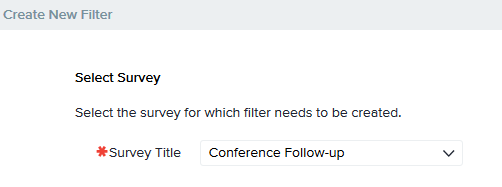
Choose the survey to which this filter applies, and select New Filter.
Give the filter a name and description.
Select the question to control the data to be displayed. In this drop-down selection, Sogolytics shows every question in the survey, including some that are not displayed to the respondent. For instance, you would see any questions you included with data prepopulation (e.g. salesperson name). You also see additional attributes about the survey from its data collection phase: response period, IP address, language in which the survey was completed, the time it took to complete the survey, and channel by which the respondent accessed the survey. So, for example, if you’re using a survey as a way to offer a final exam, you can look at results from people who answered it very quickly – or very slowly.
Choose the filter question, and then the answers that matter. In this example, I aim to look at the conference planning data for people who are serious about attending the event (absolutely or probably will attend), because I want to choose a destination most convenient to committed members. So I choose the “absolutely” and “probably” answers.
Pay attention to the AND, OR, and NOT criteria. In this case, the “will you attend?” question permits only a single answer. In other instances, the filter question may support multiple responses (“Which of these cities would be acceptable?”), and the AND versus OR results affects the data selection.
Setting filters gives you a lot of power, especially when you use more than one question to control the data displayed. For this example, you might want to look at the perceptions of people who intend to attend the conference, and who expect it to last for a longer period of time. In a different survey, you could look for the people who ate at a fast-food restaurant in the last four weeks or who purchased premade meals at a grocery store.
But for the moment, let’s keep it simple: just the committed attendees. Choose “save and go to filter manager,” where your filter now appears in the list.
Ready to apply the filter? Go back to the general Reports screen, and choose any report you like – say, a bar graph. Create it the way you ordinarily would, choosing the questions, their order, and other controls. The final step controls the use of filters, where you choose from any filters associated with this survey.
The report shows only the filtered data, with a header showing the selection criteria and how many met those criteria.
The resulting report makes it a lot easier to evaluate the opinions and behaviour of market segments. So get in the habit of creating filters for a unique view into the data you’ve collected!


