The Dimension Analysis Report (DAR) is one of Sogolytics’s most advanced reports. A powerful tool that offers analysis of trends across time and participant groups, this report has many uses when comparing different topics or dimensions across up to 16 surveys at once.
Here are three use cases for anyone looking for some DAR inspiration.
A Company Culture Look
You’re trying to get a look at your company culture—how are your employees feeling about the company with regard to leadership, benefits, and innovation? If you want to figure out how each of these dimensions compares over four quarters, that’s where the DAR comes in.
Build one survey with questions that meet the dimensions of each category you want to look at. Apply the QIDs (question identifier — a four to five numerical string) to the questions. Then, based on assigned QIDs, each question is divided into the right categories you want to compare data to in your reporting. From there, you can just copy that survey and send it out, plus or minus a few tweaks, each quarter. You can generate a DAR report as you go or collect the data from all four reports and run the DAR at the end of the year.
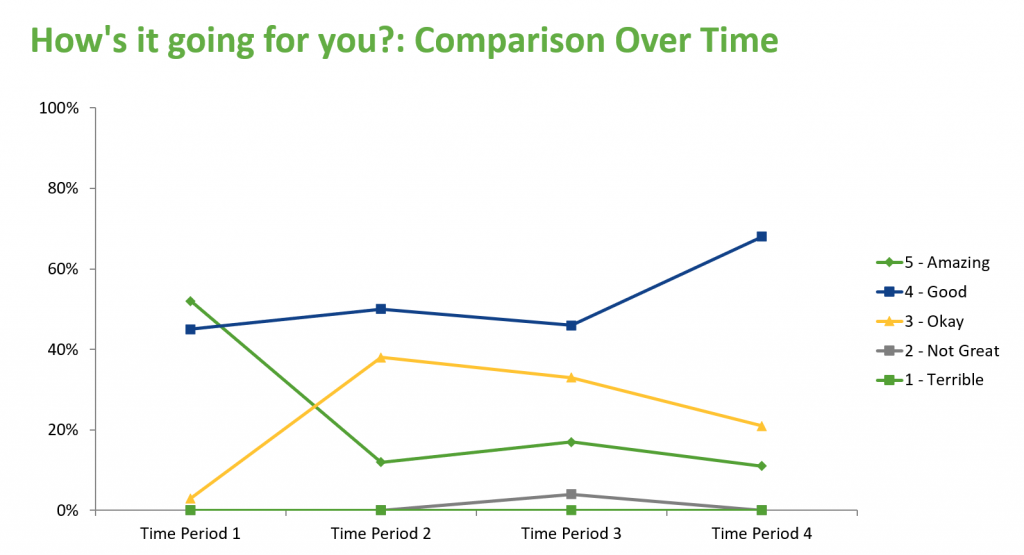
By the end of the year, this report will deliver graph breakdowns and insights into how satisfied your employees are with the overall company. Compare how those satisfaction rates rise or fall each quarter. Recognize the outlier percentages and areas where the company scored abnormally high or low. All this data and more comes from just one report.
A 360 Company Perspective
Getting a perspective on your company from multiple vantage points can be extremely useful. Seeing the trend of those same views change over time is invaluable. By generating a DAR report, you’ll be able to see this data in a multi-tab report. Start by creating three different surveys, each with grid questions oriented towards the appropriate audience like your customers, employees, and department heads. This will give you the right base for your comparisons. Send out each survey annually to the appropriate groups. To ensure the report correctly analyzes your dimensions, code each survey with the matching QIDs for each survey.
Year over year, you will be able to see how opinions among these three groups have reacted to changes implemented in the company. Almost half a decade’s worth of trends can be seen in one DAR report. And if a major external factor occurs one year, like a global pandemic, you can easily tell what areas it affected your company from the various viewpoints you monitor regularly. The DAR provides a long-term view of company health from all angles.
A Retroactive Look Forward
Seeing a time trend analysis with DAR is not just limited to data you will get in the future. Past data, either from old surveys in your account or from other platforms can be imported in and used in a DAR report. For example, see how customer feedback on different products has changed over the past few years. Applying the correct QIDs on the relevant product feedback surveys across the years will allow you to compare those trends with current data.
Running the report will provide you comprehensive graphs on just what customers think of your products over time. From graphs and tables, get insights into what’s working and what needs to be changed in the future. Create your own benchmark data by comparing each year to the standards set by your first surveys.
So Much More
There are so many use cases for a DAR report. Compare internal and external perspectives on your company’s performance, track year-on-year product improvements, and more. Get access to the Dimensional Analysis Report in your account today!


