Happy new year! We’re just a week into 2023, but we’ve already got updates to share! Our development and release cycle continues at this super speedy sprint pace, which means a variety of improvements will continue to appear in your account regularly — from nearly invisible tweaks to sweet new features.
Today, we’re sharing a few highlights from Sogolytics sprint 30.7. (Need to catch up? Revisit 30.6 first!)
First things first: A reminder that options vary by account type. Log in to see for yourself or drop a note to our support team with any questions.
Dynamic Comparisons step it up
- Report-level comparison for all Rating and Metric questions
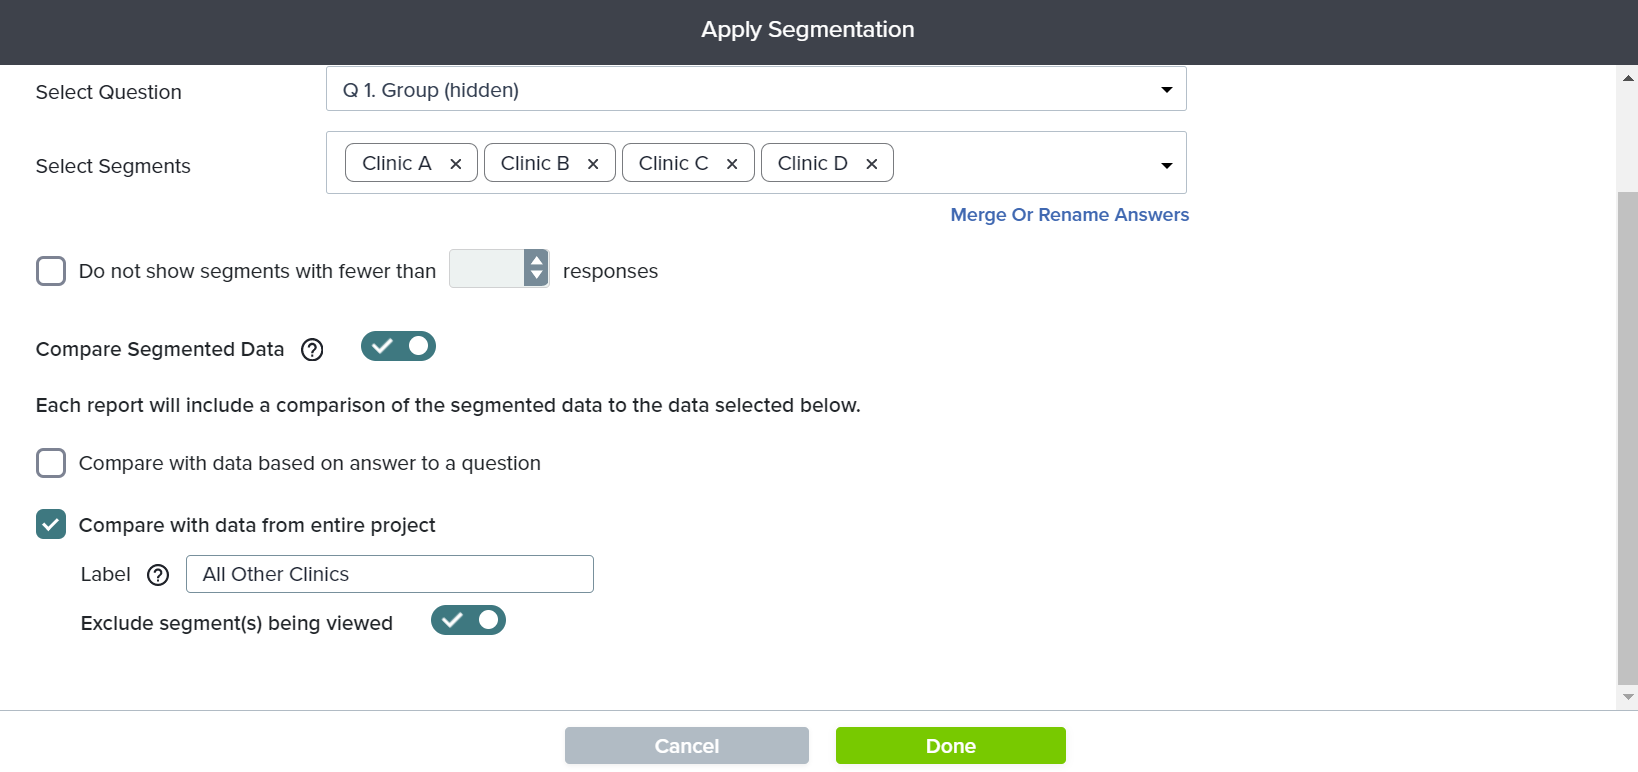
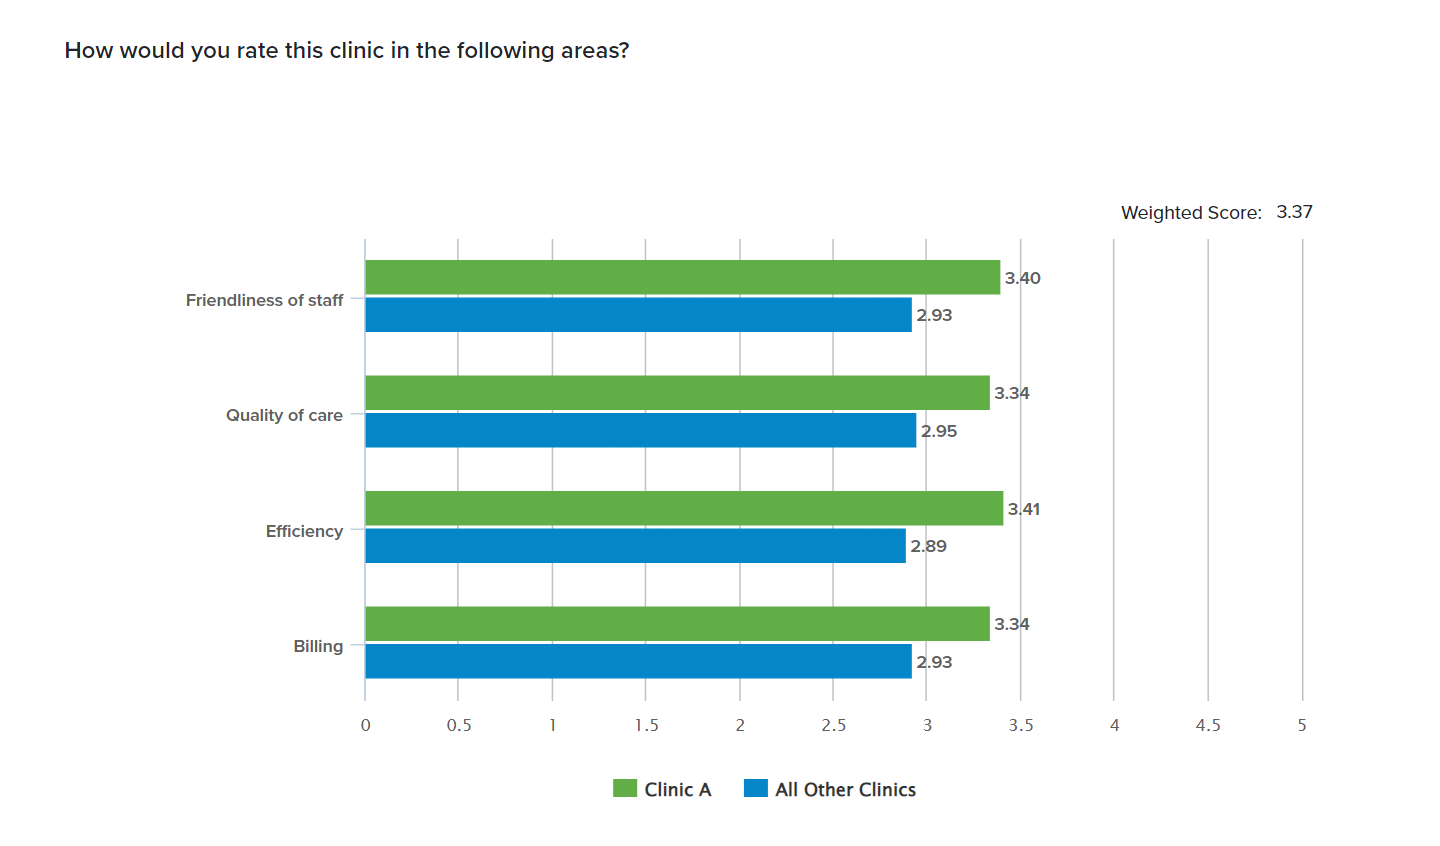
Want to see how each slice of your data stacks up against the rest? Maybe you’d like to see how patient satisfaction at one clinic compares to the rest (especially if you suspect something’s up!). No surprises here — it’s all about segmentation. Omni segmentation makes it easy to take a closer look at each defined comparison in a single report. But what if you want to split your results into multiple reports (hello, report-level segmentation!) and see different comparisons for each — clinic A versus the rest, clinic B versus the rest, etc.?

We recently rolled out Dynamic Comparison for NPS trend graphs, and with this release, we’re expanding the same idea to all rating questions, including standard and custom CX metric type questions. Now, when you set up report-level segmentation, you’ll have the opportunity to apply Overall and Dynamic comparison options. A quick note: If you’ve chosen to look at your graph as a percentage breakdown (30% Strongly Agree, 12% Agree, etc.), you’ll need to switch to metric with a single value (NPS, weighted score, etc.) to use this comparison.

Trend Alert: Conditional formatting in trend tables
- Conditional formatting added in Omni trend tables
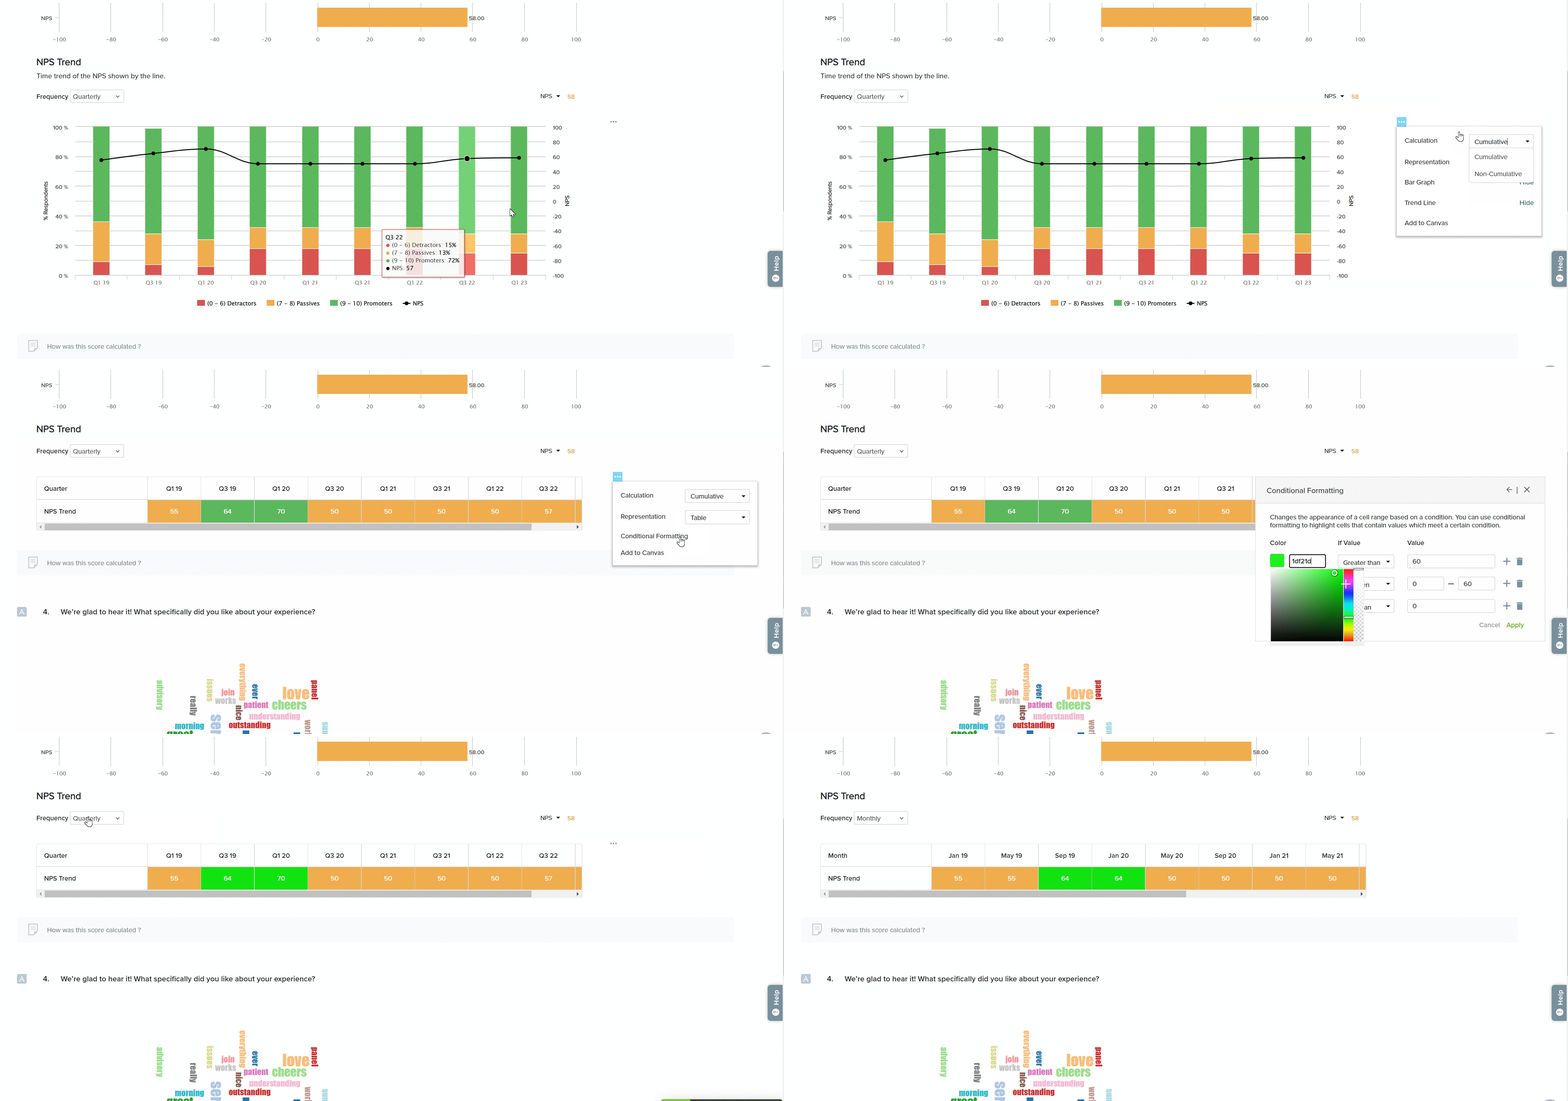
Want to get more insights out of your data tables? In this release, we’re rolling out Conditional Formatting for Omni trend tables on several key rating question types, making it easier for you to showcase the details that matter most to you and your audience. At a glance, you’ll see the high points, low points, and any other key ranges you’d like to highlight.
Start with three conditions and add up to five conditions. For NPS, default color values will be shown automatically, and for other questions (Rating questions, including CES, CSAT, KDA, Symbol Rating, Grid), you can edit or add conditions as needed.

Enhancements to translation uploads
- Differentiation between text import options for multi- and monolingual projects
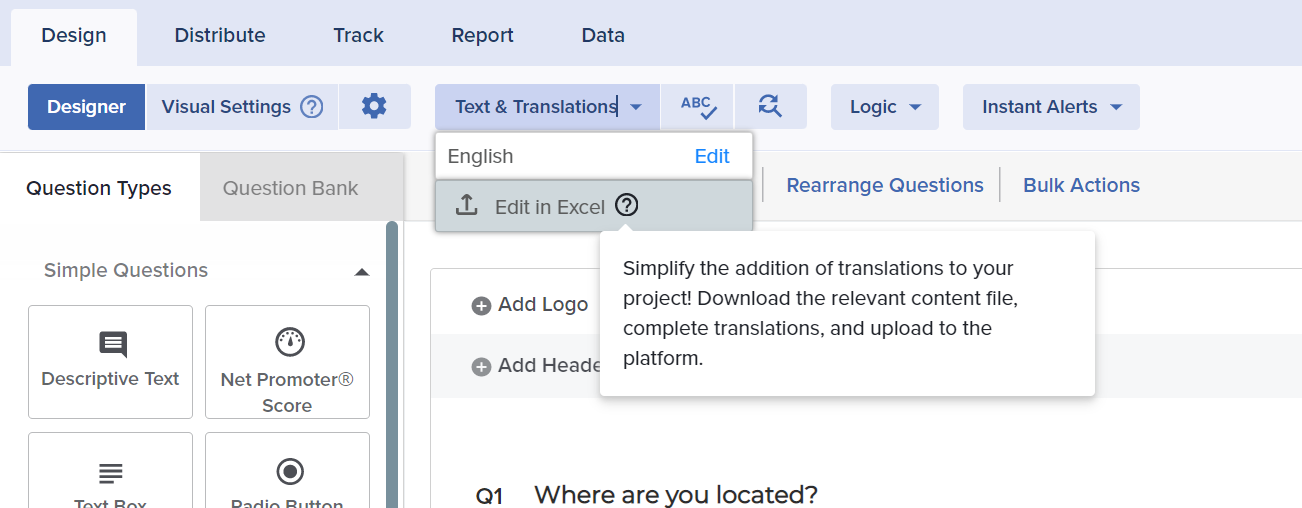
Have you tried importing translations through Excel yet? We’ve been hearing great feedback from our clients on how much time they’ve saved in adding translated text and how simple the process is. (In fact, this was one of our highest-rated #favoritethings of 2022!) Feeling left out because you’re not running a multilingual project at the moment? We’ve got you! If you’ve built your survey project in just one language but need to update text in multiple places, it’s now easier to make these changes all at once, too.
Simply create your project, then export a custom Excel file containing all of your questions, answers, and additional messages. Then, share that file with your favorite editor (or editors!) for updates. Once they’re done, upload the edited file back into the platform and you’ll see the text changes updated across your survey project. Awesome, right?

And a few more…
- Improvements to hard-coded messages in Design and Participation
- In-app textual updates for clarity
- UI updates to improve usability
- Security and performance improvements
Want more? Log in and see for yourself, then stay tuned — sprints move fast!


