You’ve heard it countless times, but I’ll say it louder for the people in the back: Customer experience should be a priority.
Think it’s not worth the investment? One dollar invested in CX is expected to receive a $3 return on investment. That alone should be enough for you to take a second look at your current CX.
When trying to improve CX, it can be hard to know where to start and what to focus on. Key Driver Analysis is a great jumping off point because it tells you where you should focus your efforts.
With Key Driver Analysis, you find out what’s working, what’s not, and which of these factors actually affect your CX score. From there, decide which practices you should be improving, which you should be sustaining, and which you should drop completely.
Save you and your team from expending energy on fruitless projects that won’t increase you CX by utilizing Key Driver Analysis. Read on to learn more about KDA and how you can employ it to create a better customer experience.
What is Key Driver Analysis?
Key Driver Analysis is a tool that calculates the correlation between CX scores and points in your customers’ experiences.
There are two prerequisites for a Key Driver Analysis. First is a CX metric question relevant to your CX objective. Types of CX metrics include Net Promoter Score (NPS), Customer Satisfaction Score (CSAT), and Customer Effort Score (CES). Second is a Key Driver question that presents variables that might influence this metric.
For example, you might be interested in improving your customer loyalty. NPS would be your metric. Your Key Driver could include variables such as employees, product, service, or value. Key Driver Analysis analysis would provide you with information on which of these variables affects NPS and if they are positively or negatively correlated.
The Math Behind the Metrics
Stats for Success
Key Driver Analysis uses multiple linear regression to uncover correlations between drivers and outcomes. This analysis provides both strength and direction (positive or negative) of the association. Drivers that significantly affect an outcome are called Key Drivers.
The Calculations of Key Driver Analysis
Performance is the weighted average of all responses for a driver. Weights are usually assigned on a scale from 1 to 5. Performance is usually viewed as a percent of the weighted score. Correlation is a quantified amount by which the overall metric will change for every 1-point change in the weighted score of the driver. Correlation values are presented between 0 and 1. Let’s break it down:
The scale
The average weighted score
The performance score and correlation
In Charted Territory
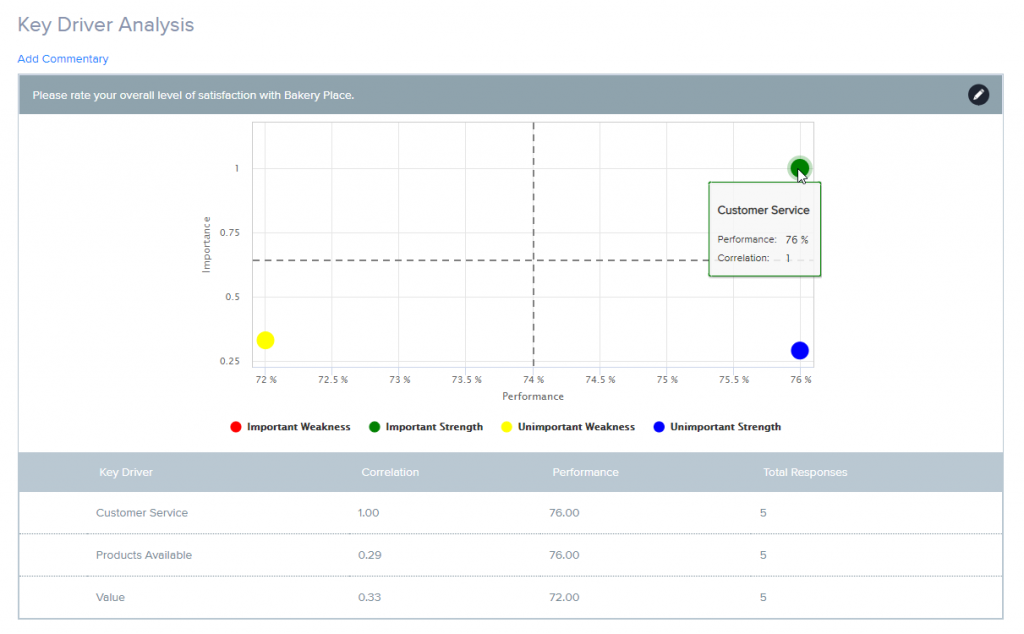
Your hard-earned numbers are meaningless if you can’t interpret the data of your Key Driver Analysis. Most often, Key Driver Analysis is viewed on a 2×2 matrix. The x-axis shows the performance of a driver variable, and the y-axis indicates the impact of a driver variable on the chosen metric.
The origin of the graph represents the median of performance values and the median of correlation values. The four quadrants of the graph represent four different types of drivers.
In quadrant 1 are drivers that have below-average performance and a high impact on the metric. These key drivers are problem areas that you should put effort into fixing. Because the correlation score is high in this quadrant, increased performance scores mean a great increase in the CX metric score.
Quadrant 2 also houses key drivers. These drivers are performing better than average and have a high impact on the metric. You should put effort into sustaining the performance of these drivers.
Quadrant 3 drivers have drivers that have lower than average values in both performance and importance. These are problem areas, but if fixed, they won’t raise the overall metric score by much.
Lastly, quadrant 4 sees drivers that are performing better than average but have low importance. These drivers indicate areas where your company is doing well but have little impact on the CX metric. The drivers in this quadrant don’t need much attention.

A Helping Hand from SoGoCX
If you’re new behind the wheel of Key Driver Analysis, you don’t have to do it alone. The user-friendly design and seasoned professionals with SoGoCX make it easy to reach your CX destination. From creating your drivers to generating your report, we’ve got you covered.
From Drivers to Dashboard
Drivers are anything that impact how your customers feel about your company. This can be professionalism of customer service, value of product, helpfulness of newsletters, etc. In SoGoCX drivers aren’t limited to just the Key Driver question type; any weighted question can be used. Place your CX metric question and drivers in your survey and send it out. Once you’ve collected responses, you can view the insights on the Dashboard where you can modify and add drivers.
Rendering Your Report
Generating your Key Driver Analysis report is super easy in SoGoCX. All you have to do is click on the Report tab and then the Key Driver Analysis button on the navigation bar at the top of the page. In the Key Driver Analysis Report you can view survey metrics, implement properties and filters, and add commentary. Once you have it set as you like, you’ll be on the right track for CX success.
Want to learn more about how SoGoCX can benefit your company? Visit our site and sign up for a demo today!


