In Part 2, we talked about some of the popular reports in Sogolytics, such as the Individual, Conditional, and Verbatim reports. Now we’re ready to look at the Filter Manager and two effective reports that can help you increase your survey response rate ― Response Trend and Response Rate.
Filter Manager
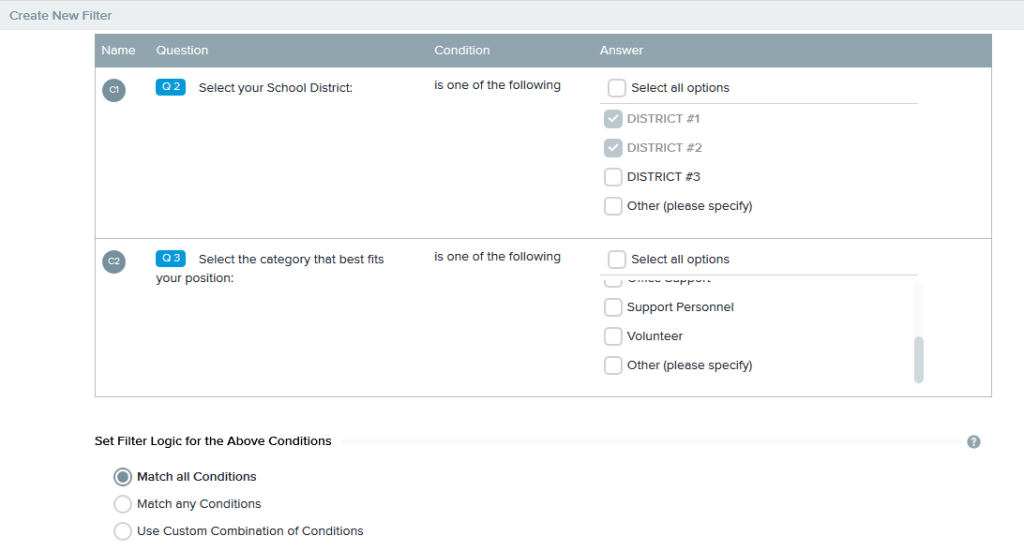
The Filter Manager allows you to filter the data displayed in reports by certain criteria. For example, if you wanted to know product preferences for men over the age of 40, with an income over $50,000, you could set a filter that only shows results for participants that meet these criteria.
You can save and apply the same filter to all of the reports in Sogolytics. You can apply up to 50 conditions, so filters can be complex, and are only limited by what you want to know about your audience.
To create a filter:
- Go to Run a Report and click the Filter Manager sub-tab.
- Select the survey for which you want to create a filter.
- Give your filter a name and description.
- Select the question on which you want to apply the condition, and select the applicable answer for this question, then click Add. Repeat these steps to add other conditions.
- Apply Filter Logic on these conditions. Select Match All Condition(s) for the filter to execute only when all the conditions are satisfied.
- Click Save or Save & go to Filter Manager.
Applying a Filter to Reports
You can apply filters to reports in two ways:
- While generating a report, in the wizard, go to the step called Select Filter.
- After generating a report, click on the Apply Filter link, located at the top right of the report page.
Response Trend Report
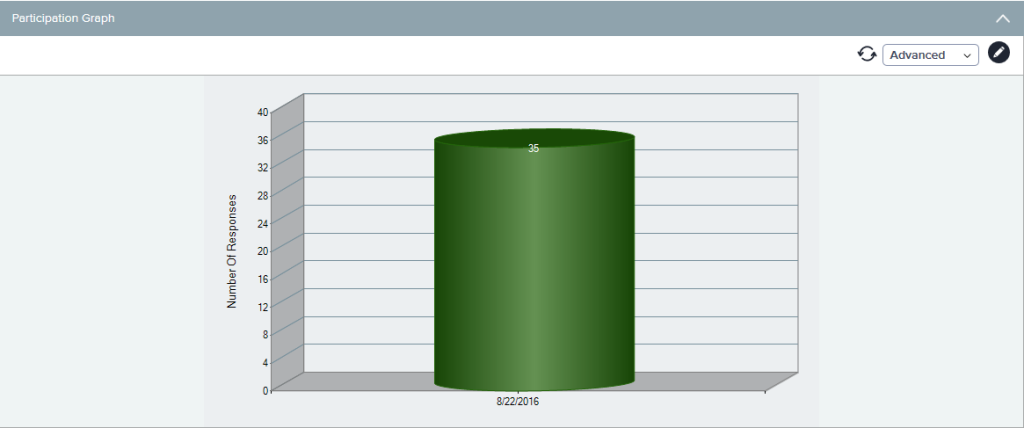
The Response Trend Report allows you to view the number of responses you’re receiving to your survey. You can use this report while your survey is live to keep track of survey participation.
If very few people have taken the survey, you may need to reach out again to encourage participation. Or, you may need to ensure the survey invitation was not marked as SPAM.
If response rates are trending down, it may be time to close out the survey. The report can also help you determine what days of the week are best for sending out your survey. As you can see, this report is extremely valuable for increasing response rates.
To run the report:
- Go to Run a Report and select your survey.
- Select Response Trend. Unlike other reports, this report is generated without going through steps in a wizard.
- Under Report Properties, you can change the default Time Range and Scale that you want to display on the horizontal axis.
- To customize the report, click the Basic drop down and then click Advanced.
- To place the graph on your Home Dashboard, click the Prepare for dashboard link at the top. This deposits the graph in the Dashboard Inventory, from which you can place it on the Dashboard.
Response Rate Report
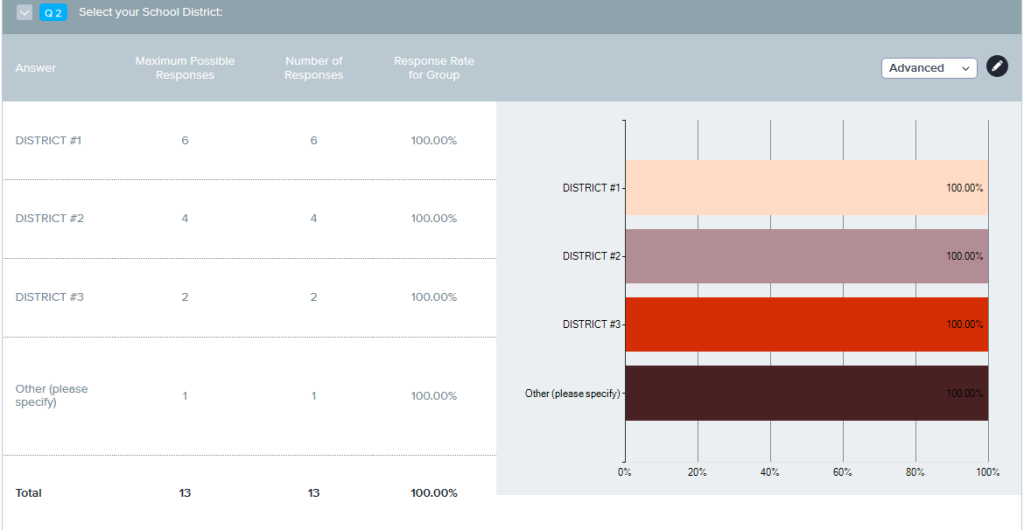
This report allows you to observe trends in responses for a specific survey question. If you’re not getting many responses to a certain question compared to other questions in the survey, you will want to try to understand why. For example, if only 20% of respondents answered the question and 80% answered other questions, there is probably something wrong with the question.
To run the report:
- Go to Run a Report and select your survey.
- Select Response Rate.
- Select the question for which you want the response rate calculated.
- The maximum possible responses displayed by default are the total count of responses received to date for each answer option. In most cases, you will not need to change those numbers.
- To proceed, you must check the box next to I have reviewed the maximum possible responses for each group indicated above.
- Click Next and select your desired report properties.
- Click Generate Report. As with the Response Trend Report, you can customize the report and add it to your dashboard.
My next post will be an overview of the Cross-Tab and Comparison reports. Stay tuned!
― Patti Frasier, Sogolytics Blog Team


